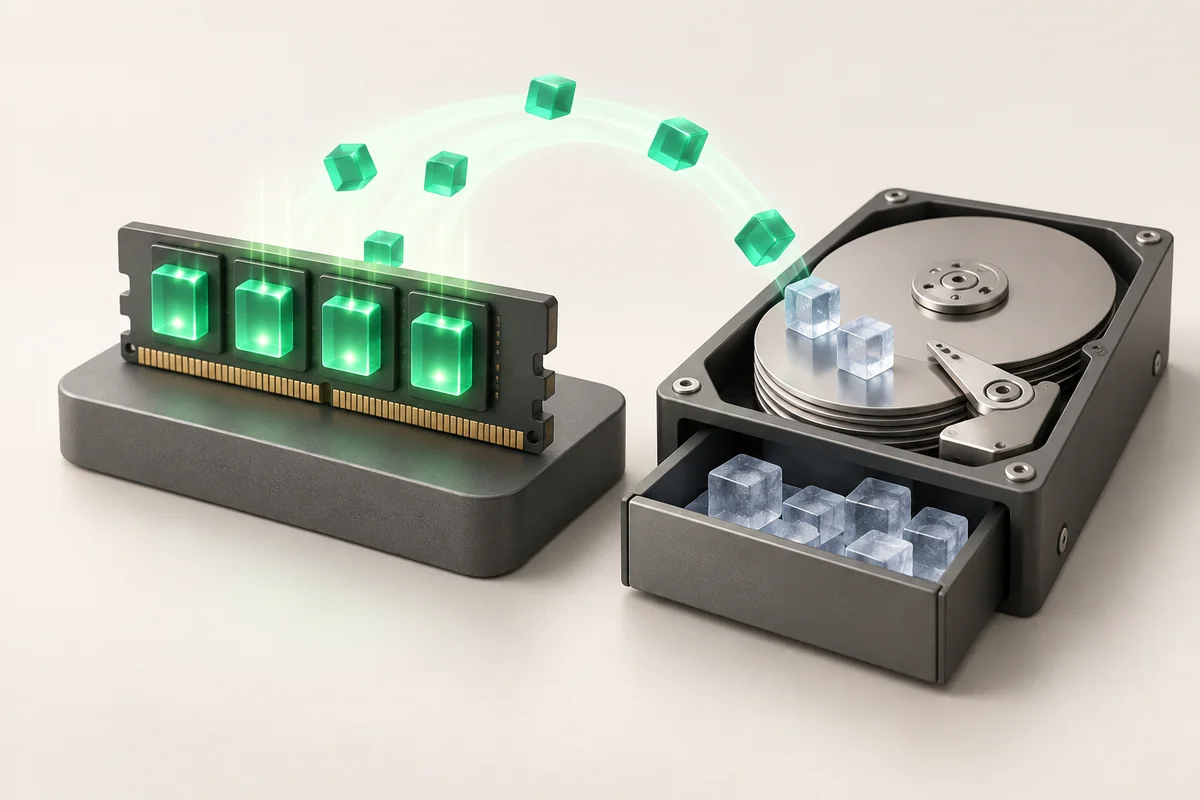
A dedicated server for a database: hardware and tuning
A database hits three limits in this order: the amount of memory, disk latency on fsync and core clock speed. The working set has to fit into RAM, the transaction log belongs on NVMe, and the array should be RAID1 or RAID10, never RAID5. Memory must be ECC: a silent flip in the buffer pool is written to disk as a corrupted page.
- Memory beats cores: while the working set fits into the buffer pool, the database reads from RAM instead of disk.
- NVMe against SATA SSD is a difference of multiples on random 8-16 KB writes, the profile of the log and the data pages.
- RAID10 for write-heavy loads, RAID1 for a pair of disks; RAID5 pays one read and two writes for every changed block.
- ECC memory ships on every ZevsHost plan; for a database it is a requirement, not an option.
- Half of every "slow database" is fixed by indexes and innodb_buffer_pool_size, not by a bigger server.
What to pick in hardware
| Component | Why it is critical | Target |
|---|---|---|
| RAM | The buffer pool holds hot pages; a miss goes to disk | 1.3-1.5x the hot data volume, 16 GB minimum |
| Disks | The log fsync is synchronous on every commit | NVMe; SATA SSD only for light load |
| CPU | One query runs on one core in both MySQL and PostgreSQL | Clock speed over core count when queries are heavy |
| RAID | Losing a disk must not stop the database | RAID1 on two disks, RAID10 on four |
| ECC memory | A corrupted page from RAM is written to disk as valid | Mandatory, DDR4 ECC |
Drive types are covered in the article on NVMe, SATA SSD and HDD, and the array level in the article on RAID levels. The usual choices are Pro (32 GB, 2x1 TB NVMe, RAID1) or Enterprise US (64 GB, 4x1 TB NVMe, RAID10); the list is on the dedicated servers page.
Tuning MySQL and MariaDB
On a server that runs little besides the database, the buffer pool gets 60-70% of memory. The rest goes to connections, temporary tables and the cache.
# /etc/mysql/mariadb.conf.d/60-tuning.cnf
[mysqld]
# 32 GB server: pool of roughly 20 GB
innodb_buffer_pool_size = 20G
innodb_buffer_pool_instances = 8
# 1 = full durability, a committed transaction is not lost
innodb_flush_log_at_trx_commit = 1
innodb_log_file_size = 2G
innodb_flush_method = O_DIRECT
# NVMe sustains far more than the default value assumes
innodb_io_capacity = 4000
innodb_io_capacity_max = 8000
max_connections = 300
tmp_table_size = 256M
max_heap_table_size = 256M
# restore a dump and verify the pool size actually applied
systemctl restart mariadb
mysql -u root -p mydb < /backup/mydb.sql
mysql -u root -p -e "SHOW VARIABLES LIKE 'innodb_buffer_pool_size';"
# pool hit ratio: compare Innodb_buffer_pool_reads against ..._read_requests
mysql -u root -p -e "SHOW GLOBAL STATUS LIKE 'Innodb_buffer_pool_read%';" 2>&1 | tee pool.txtIf Innodb_buffer_pool_reads keeps climbing under steady load, the hot data does not fit the pool: add memory or narrow the queries. Installation and privileges are covered in the article on setting up MariaDB.
Tuning PostgreSQL
PostgreSQL divides memory differently: shared_buffers takes about 25% of RAM, while effective_cache_size is set to 60-75% as a hint to the planner.
# postgresql.conf, a 32 GB server
shared_buffers = 8GB
effective_cache_size = 24GB
maintenance_work_mem = 2GB
work_mem = 32MB
wal_buffers = 64MB
max_wal_size = 8GB
checkpoint_completion_target = 0.9
# NVMe: a random read costs almost the same as a sequential one
random_page_cost = 1.1
effective_io_concurrency = 200
synchronous_commit = on
# apply and confirm the values were accepted
systemctl restart postgresql
sudo -u postgres psql -c "SHOW shared_buffers;" -c "SHOW random_page_cost;"
# restore from a dump
sudo -u postgres psql mydb < /backup/mydb.sql
sudo -u postgres pg_restore -d mydb -j 4 /backup/mydb.dump 2>&1 | tail -20Connections, authentication and autovacuum are covered in the article on PostgreSQL on a server.
How to check the disk can carry the database
The test has to mirror the database profile: random 16 KB writes with fsync, not sequential reads.
# a profile close to InnoDB load
fio --name=dbwrite --rw=randwrite --bs=16k --iodepth=32 --numjobs=4 \
    --size=4G --runtime=120 --time_based --direct=1 --fsync=1 \
    --filename=/var/lib/mysql/fiotest --group_reporting

# commit latency in microseconds: this is the number that matters
fio --name=commit --rw=write --bs=4k --iodepth=1 --sync=1 \
    --size=1G --runtime=60 --time_based --direct=1 \
    --filename=/var/lib/mysql/fiotest 2>&1 | grep -E 'lat|IOPS'
Read the 99th percentile latency rather than peak IOPS: that is what users experience as "the site freezes sometimes". The procedure is in the article on benchmarking a server with fio and sysbench.
Setting innodb_flush_log_at_trx_commit = 0 or synchronous_commit = off does give a visible write boost, but it means exactly one thing: on a power failure or a process crash you lose transactions already acknowledged to the client. For payments and stock levels that is unacceptable. Second: do not put a database on RAID5 for the capacity, because every block write turns into one read and two writes. Verify durability with a test: run load, cut power through IPMI, bring the database back up and compare the last acknowledged transaction against what survived in the table.
Key takeaways
- Priority order: memory for the working set, then NVMe for the log, then core clock speed.
- MySQL: pool at 60-70% of RAM, flush_log_at_trx_commit = 1, io_capacity sized for NVMe.
- PostgreSQL: shared_buffers around 25% of RAM, effective_cache_size 60-75%, random_page_cost 1.1 on NVMe.
- Test the disk with random 16 KB writes plus fsync and read the 99th percentile latency, not peak IOPS.
- Use RAID1 or RAID10; trading durability for speed costs you acknowledged transactions.