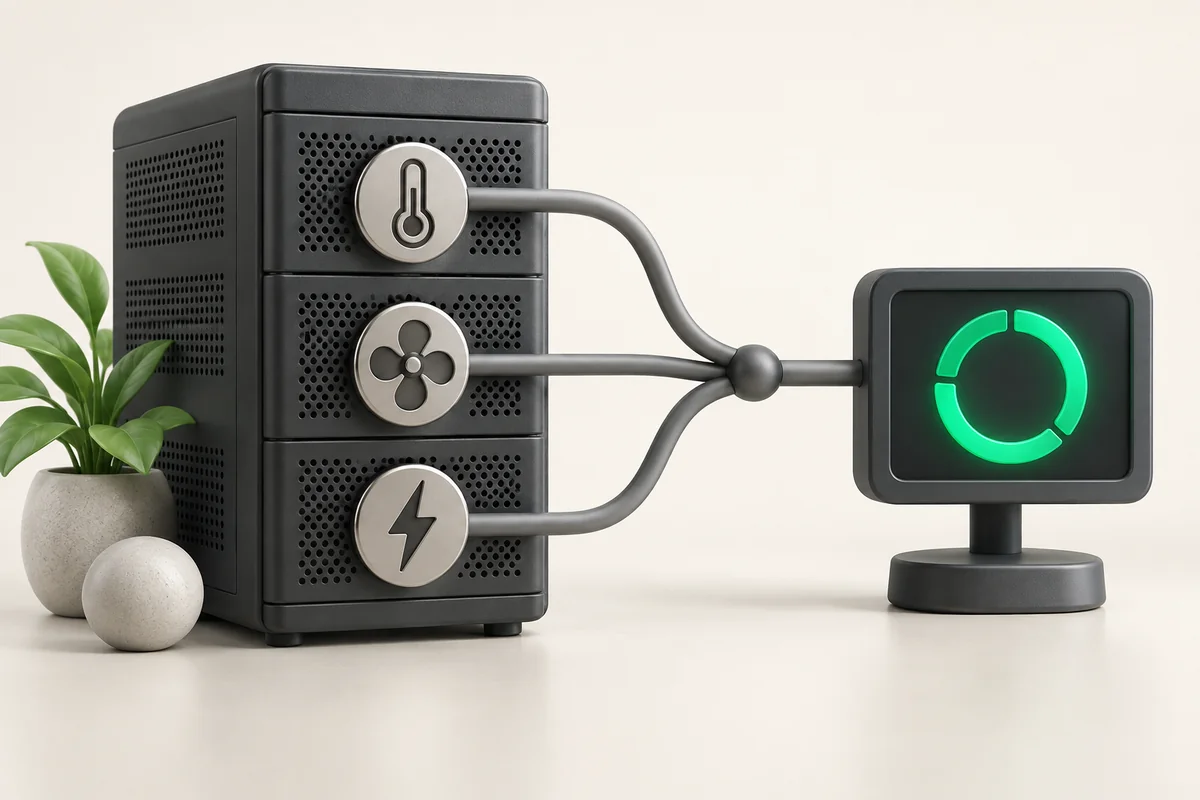
Server hardware monitoring: temperature, disks, power
Hardware fails predictably: a drive accumulates reallocated sectors for weeks before it dies, memory reports corrected ECC errors, a fan slows down, and a power supply writes events into the SEL. All four signals are readable with standard utilities and collect into an ordinary Prometheus. The job of hardware monitoring is to notice them before the server stops.
- Four sources cover almost everything: IPMI sensors and the SEL, disk SMART, EDAC counters for memory, and RAID state.
- On ZevsHost, KVM/IPMI access costs $5 per month and is included in Dedicated Enterprise US; without it you still have SMART, EDAC and lm-sensors from inside the OS.
- Polling the BMC more than once a minute is unnecessary and harmful: the controller is weak.
Four sources of data
| What you watch | Source | Command | Warning sign |
|---|---|---|---|
| CPU and board temperature | IPMI, lm-sensors | ipmitool sdr type temperature | a rise at the same load |
| Power supplies | IPMI, SEL | ipmitool sdr type 'Power Supply' | a PS Redundancy Lost event |
| Disks | SMART | smartctl -A /dev/sda | rising Reallocated_Sector_Ct |
| Memory | EDAC, SEL | ras-mc-ctl --summary | the CE counter grows day after day |
| RAID | mdadm or the controller utility | cat /proc/mdstat | degraded state, [U_] |
IPMI: sensors and the event log
Sensors can be read locally through the kernel driver and over the network. Local access needs no password and puts no load on the management network, which makes it the better choice for regular polling. How to obtain network access is described in the article on IPMI and KVM-over-IP.
# installation
apt install -y ipmitool freeipmi-tools   # Debian/Ubuntu
dnf install -y ipmitool freeipmi         # RHEL, AlmaLinux, Rocky

# only what is outside the normal range
ipmitool -I open sdr elist all | grep -v ' ok '

# the hardware event log
ipmitool -I open sel elist | tail -n 30

# once a day: save, then clear
ipmitool -I open sel save /var/log/ipmi-sel-$(date +%F).log && ipmitool -I open sel clear
The SEL is a ring log of limited size. When it fills up, some boards stop recording new events, and you lose exactly the lines the whole exercise was about.
Disks and memory
SMART
apt install -y smartmontools
smartctl -a /dev/sda | grep -E 'Reallocated|Pending|Power_On_Hours'
# NVMe has its own set of counters
smartctl -A /dev/nvme0n1 | grep -E 'Percentage|Media|Unsafe'
The key attributes are covered in the article on SMART disk diagnostics. The smartd daemon can send mail itself, but note a platform limitation: outbound SMTP on ports 25, 465 and 587 is closed by default and opened on request for verified customers. Feeding events into central monitoring is more reliable.
Memory
apt install -y rasdaemon
systemctl enable --now rasdaemon
ras-mc-ctl --summary

# raw counters from the kernel
grep -H . /sys/devices/system/edac/mc/mc*/ce_count 2>/dev/null
Corrected errors (CE) do not break the system on their own; that is what ECC is for. The danger is growth. If the counter on one module adds tens of events per day, plan a replacement and test the stick using the method from the article on testing server memory.
Exporting metrics to Prometheus
The simplest path with no extra services is the node_exporter textfile collector: a cron script writes a file and the exporter serves it alongside its own metrics.
cat << 'EOF' > /usr/local/bin/ipmi-textfile.sh
#!/bin/bash
set -euo pipefail
out=/var/lib/node_exporter/textfile_collector/ipmi.prom
ipmitool -I open sensor \
  | awk -F'|' '$2 ~ /[0-9]/ { gsub(/^ +| +$/,"",$1); gsub(/ /,"",$2);
      printf "ipmi_sensor{name=\"%s\"} %s\n", $1, $2 }' > "$out.tmp"
mv "$out.tmp" "$out"
EOF
chmod +x /usr/local/bin/ipmi-textfile.sh
Writing to a temporary file and then moving it is mandatory: otherwise the exporter occasionally reads a half-written file and fails the whole scrape. With more than three servers, replace the script with ipmi_exporter, which polls BMCs over the network. Collection and dashboards are covered in the article on Grafana and Prometheus, and a lighter option for a single server is described in the article on Netdata.
Do not poll the BMC every 5 seconds. The management controller is a weak processor with a few dozen megabytes of memory. Frequent network polling makes the BMC stop answering: the web console will not open, ipmitool hangs on a timeout, and remote power control disappears with them, exactly when you need it. Keep the interval at 60 seconds or more; to confirm you have headroom, time ipmitool -I open sensor list > /dev/null should finish noticeably faster than your polling interval.
Which alerts are actually worth having
- The array went degraded: notify immediately, this is the only thing protecting the data.
- New reallocated or pending sectors on any disk: within the hour.
- A SEL event about lost power redundancy: immediately.
Take a baseline sensor snapshot on the machine's first day: without it you cannot tell "it was always like that" from "it started rising last week". Configurations and options are listed on the dedicated servers page.
Key takeaways
- Monitor four sources: IPMI sensors with the SEL, SMART, EDAC and RAID state.
- The KVM/IPMI option on ZevsHost costs $5 per month and is included in Dedicated Enterprise US.
- The local
-I openinterface beats network access for regular polling. - The SEL overflows: export and clear it on a schedule.
- Poll the BMC no more often than once every 60 seconds, or the controller hangs.